Getting Thames Water's smart meter into Home Assistant properly
We’ve just had a Thames Water smart meter installed. It knows exactly how much water we use each hour, and the only way to see that is to log in to Thames Water’s website and squint at a bar chart. Electricity and gas have been on Home Assistant’s energy dashboard since metermon, so water was the obvious gap.
Happily, someone had already done the hard part. AyrtonB’s HA-Thames-Water is a Home Assistant integration that logs in to your Thames Water account and pulls the hourly readings, using his Thames-Water client library. The login alone is a small epic: a dance through Azure AD B2C with PKCE, CSRF tokens, a token refresh and a couple of redirects, all to end up with the right cookies to call one JSON endpoint. That was all done already.
It worked, mostly. I spent a Saturday afternoon on my fork sorting out the “mostly”.
Not blocking the house
Home Assistant runs everything on one asyncio event loop. Anything that does slow, blocking I/O on that loop stalls the whole house while it waits: lights, automations, the lot. The upstream integration called the client library’s requests-based login and fetch straight from async_update, which is exactly that. Recent versions of Home Assistant spot this and complain in the log, and for good reason.
The fix is boring but important. I pulled the client into the integration and gave it an async get_meter_usage(), which pushes the blocking login and the HTTP request onto an executor thread with run_in_executor. The event loop carries on while Thames Water thinks about it. Vendoring the client also meant one less package for Home Assistant to install. I also brought the statistics metadata up to date, since Home Assistant had deprecated the old has_mean flag in favour of mean_type.
Hours are harder than they look
The API returns a list of lines, each with a label like "13:00", the litres used in that hour and the meter reading at the end of it. The original code ignored the labels. It took the start date and counted one hour per line, trusting that the list was contiguous. That’s true right up until it isn’t:
- if Thames Water skips an hour, every reading after the gap lands an hour early;
- in spring, when the clocks go forward, there is no 1:00 at all;
- in autumn, when they go back, 1:00 happens twice.
I rewrote the conversion to read the label on every line and build the timestamp from it, in Europe/London time. When the hour goes backwards, it’s either a new day or the autumn repeat. The code tells them apart by checking whether it has already seen that date and hour. For the repeat it sets Python’s fold=1, which is the standard library’s rather obscure way of saying “the second 1:00 AM, not the first”. That’s the kind of thing you only get right with tests, so there are tests for both clock changes, day rollovers, multi-day fetches and empty responses.
Backfill and costs
The integration only ever asks for a few days of data, and it’s always about three days behind; that’s just how Thames Water’s system works. So a fresh install starts with an empty graph, even though the website has years of history.
I added a thames_water.fill_historical_data action. You give it a start date and it walks forward a week at a time, fetching each chunk and pushing the lot into Home Assistant’s long-term statistics. A chunk that fails is logged and skipped rather than ending the whole run.
The first reading it finds also sets a new initial meter reading entity. Every statistic is stored relative to that, so the graph starts at zero instead of at the meter’s lifetime total. Until the initial reading is set, the integration won’t write any statistics at all. That’s for anyone who inherits a smart meter when they move in. I’m assuming you can’t get the history from before your time, so the meter would already be well into its count when your data starts. It doesn’t apply to us, since ours is brand new, but it seemed worth handling for anyone else who uses the fork.
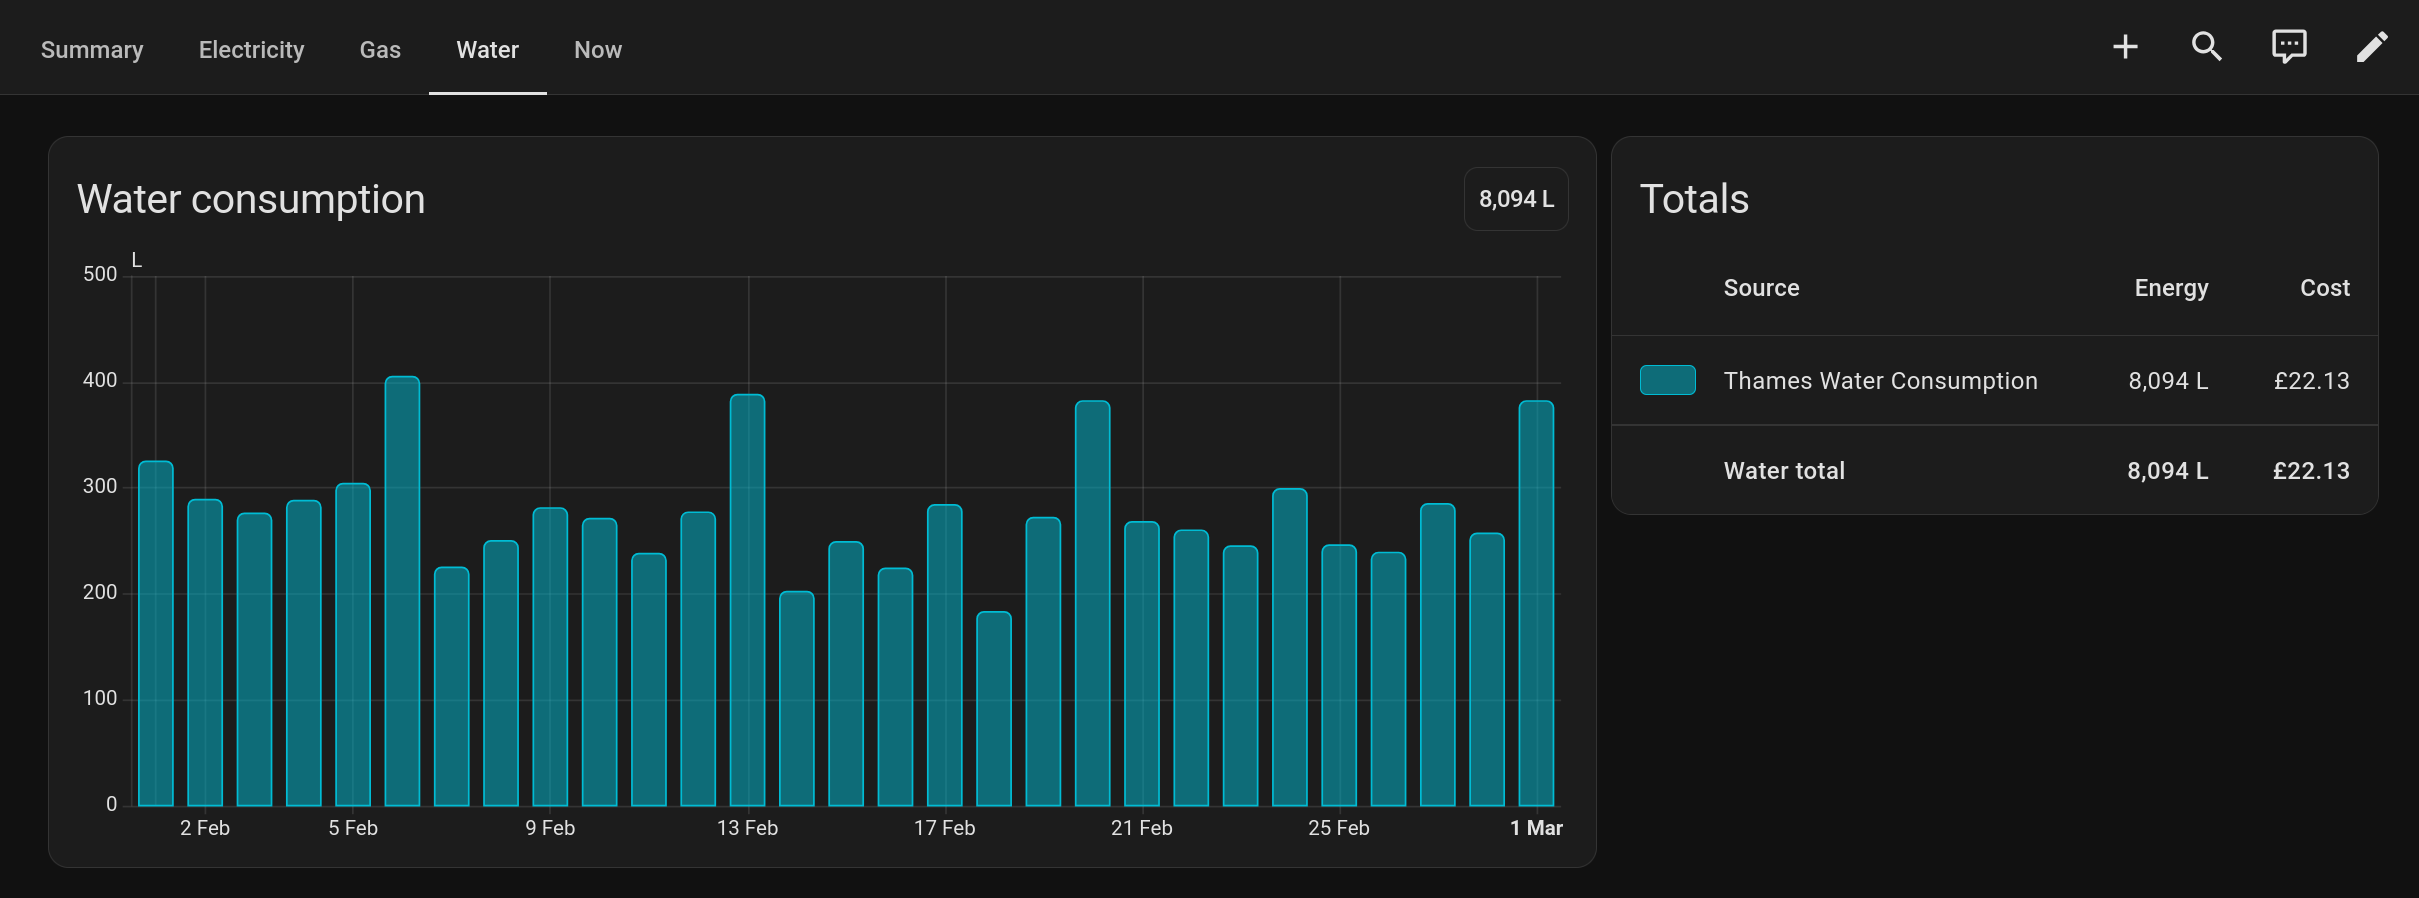
Then there’s the money. The energy dashboard is far more persuasive in pounds than in litres, so there’s now a cost statistic alongside the consumption one. The price comes from a cost per cubic metre entity, which defaults to £2.7346/m³, Thames Water’s published clean-water rate. Because it’s an ordinary Home Assistant number entity, it doesn’t have to be typed in by hand. The README shows how to pull the rate off Thames Water’s tariff page with the Scrape integration and copy it across with a small automation, so a price rise shows up on the dashboard without me having to notice it first.
Where it stands
My fork is on GitHub and installs through HACS as a custom repository. It fetches new data at midnight and noon, backfills on demand, and puts both litres and pounds on the energy dashboard. All the credit for the login goes to AyrtonB; my contribution was mostly making it behave itself.
Project assisted by Claude Code.